IC Markets Home Sign in Web Trader Contact Us
IC Markets Social IC Markets Social

مركز المعلومات
للمتداولين الجادينs

  • ABOUT US
  • OPEN LIVE ACCOUNT
  • OPEN DEMO ACCOUNT
  • TRADE NOW
  • VISIT OUR BLOG
IC Markets Social
  • ABOUT US
  • OPEN LIVE ACCOUNT
  • OPEN DEMO ACCOUNT
  • TRADE NOW
  • VISIT OUR BLOG
May 21, 2021North_American_Stocks_enIC Markets

US SPX 500 Index approaching important 4178.5000 price line

US SPX 500 Index is approaching the resistance line of a Resistance. It has touched this line numerous times in the last 5 days. If it tests this line again, it should do so in the next 23 hours.

Read more
May 20, 2021North_American_Stocks_enIC Markets

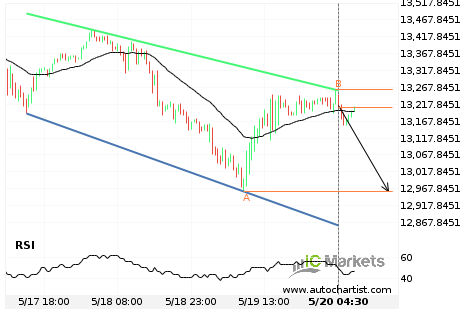
Will US Tech 100 Index have enough momentum to break support?

US Tech 100 Index is heading towards the support line of a Channel Down and could reach this point within the next 16 hours. It has tested this line numerous times in the past, and this time could be no different from the past, ending in a rebound instead of a breakout. If the breakout […]

Read more
May 19, 2021North_American_Stocks_enIC Markets

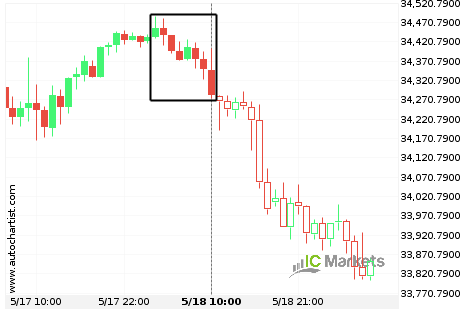
US Wall Street 30 Index is on its way down

US Wall Street 30 Index has experienced an exceptionally large movement lower by 0.51% from 34,431.8 to 34,281.2 in the last 8 hours.

Read more
May 18, 2021North_American_Stocks_enIC Markets

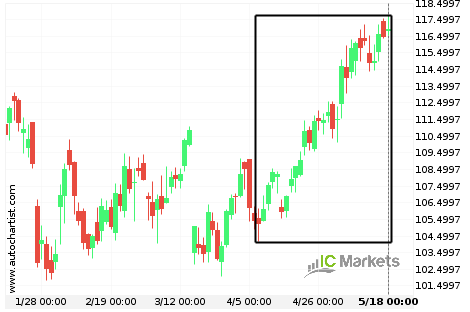
Where is AbbVie moving to?

A movement of 11.1% over 42 days on AbbVie doesn’t go unnoticed. You may start considering where it’s heading next, a continuation of the current upward trend, or a reversal in the previous direction.

Read more
May 17, 2021North_American_Stocks_enIC Markets

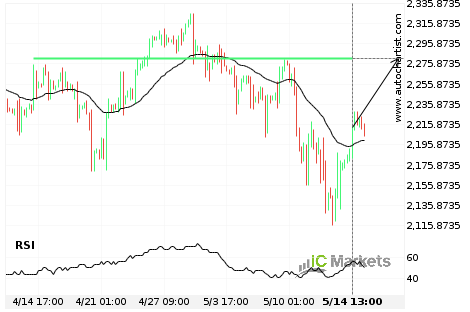
Breach of important price line imminent by US Small Cap 2000 Index

US Small Cap 2000 Index is moving towards a line of 2281.1001 which it has tested numerous times in the past. We have seen it retrace from this positions in the past, so at this stage it isn’t clear whether it will breach this price or rebound as it did before. If US Small Cap […]

Read more
May 14, 2021North_American_Stocks_enIC Markets

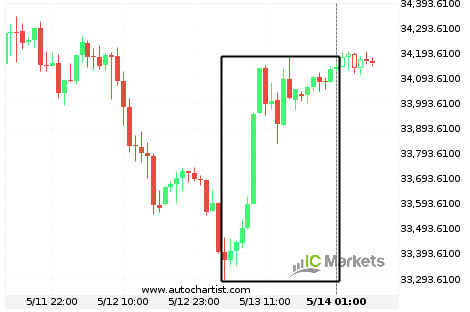
Huge bullish move on US Wall Street 30 Index

US Wall Street 30 Index has moved higher by 2.3% from 33,399.7 to 34,135.4 in the last 21 hours.

Read more
May 13, 2021North_American_Stocks_enIC Markets

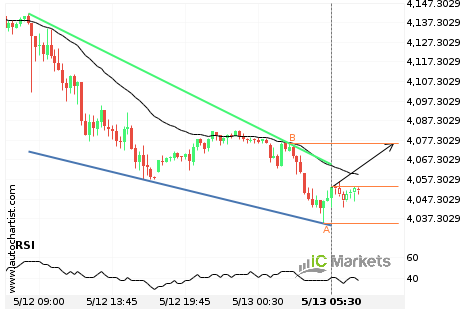
US SPX 500 Index approaching resistance of a Falling Wedge

US SPX 500 Index is approaching the resistance line of a Falling Wedge. It has touched this line numerous times in the last 21 hours. If it tests this line again, it should do so in the next 5 hours.

Read more
May 12, 2021North_American_Stocks_enIC Markets

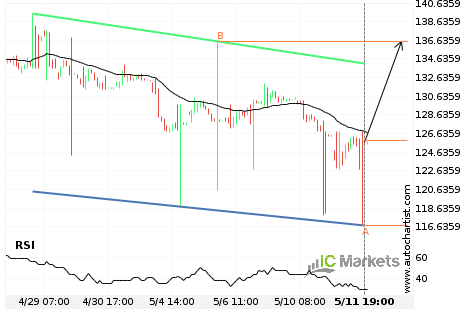
Either a rebound or a breakout imminent on Apple Inc.

Apple Inc. is heading towards the resistance line of a Channel Down. If this movement continues, we expect the price of Apple Inc. to test 136.5473 within the next 2 days. But don’t be so quick to trade, it has tested this line numerous times in the past, so this movement could be short-lived and […]

Read more
May 11, 2021North_American_Stocks_enIC Markets

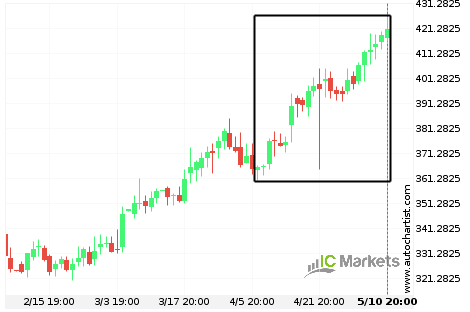
Unitedhealth Group Inc. is on its way up

Unitedhealth Group Inc. has experienced an exceptionally large movement higher by 15.11% from 364.37 to 420.89 in the last 35 days.

Read more
May 10, 2021North_American_Stocks_enIC Markets

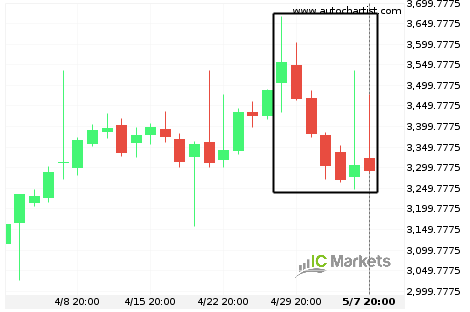
Huge bearish move on Amazon.Com Inc.

Amazon.Com Inc. has moved lower by 7.46% from 3,505 to 3,289.89 in the last 10 days.

Read more
  • 1
  • 2
  • 3
  • …
  • 36
  • 37
  • 38
  • 39
  • 40
  • 41
  • 42
  • …
  • 45
  • 46
  • 47

Recent Posts

  • US Wall Street 30 Index – المستوى الرئيسي – مقاومة
  • Brent Oil vs US Dollar – نموذج الرسم البياني – قناة صاعدة
  • Brent Oil vs US Dollar – نموذج الرسم البياني – قناة صاعدة
  • Hong Kong 50 Index – نموذج الرسم البياني – مثلث صاعد
  • Hong Kong 50 Index – รูปแบบกราฟ – สามเหลี่ยมขาขึ้น

Recent Comments

    Translation


     Edit Translation

    فتح الحساب وتمويله بشكل فوري

    تداول خلال دقائق!

    ابدأ اختبر حساب تجريبي مجاني

    نبذة عن IC Markets Global

    • مركز المساعدة
    • لماذا تختار IC Markets Global؟
    • التنظيم
    • الوثائق القانونية
    • اتصل بنا

    مواصفات التداول

    • الفروقات والعمولات
    • مجموعة المنتجات
    • ساعات التداول
    • التمويل
    • السحب

    تداول الفوركس

    • استعراض الحسابات
    • افتح حساب
    • إطلاق Web Trader


    Forex Trading

    • Accounts Overview
    • Open an Account
    • Launch Web Trader

    Trading Specifications

    • Spreads and Commissions
    • Range of Market
    • Trading Hours
    • Funding
    • Withdrawal

    About IC Markets

    • Chat with a Specialist 24/7
    • Why IC Markets
    • Regulation
    • Legal Documents
    • Contact Us

    IC Markets Global هو الاسم التجاري لشركة Raw Trading Ltd، التي تخضع لرقابة هيئة الخدمات المالية في سيشل (FSA) برقم ترخيص تاجر الأوراق المالية SD018.

    تحذير من المخاطر: ينطوي تداول الفوركس وعقود الفروقات على مخاطر عالية على رأس المال، لذا يُنصح بالتداول فقط بالأموال التي يمكنك تحمل خسارتها. قد لا يكون تداول الفوركس وعقود الفروقات مناسبًا لجميع المستثمرين، لذا يُرجى التأكد من فهمك التام للمخاطر المُحتملة، وطلب استشارة مستقلة عند الحاجة. يُرجى قراءة بيان إفصاح المخاطر والتأكد من فهمك التام له.

    الدول المحظورة : لا تقدم شركة Raw Trading Ltd خدماتها لسكان دول معينة مثل الولايات المتحدة الأمريكية وكندا والبرازيل وإسرائيل ونيوزيلندا وإيران وكوريا الشمالية (جمهورية كوريا الشعبية الديمقراطية) أو دولة يكون فيها مثل هذا التوزيع أو الاستخدام مخالفًا للقانون أو اللوائح المحلية.

    يجب أن تكون قد بلغت الثامنة عشرة من عمرك، أو السن القانوني المحدد في بلدك. بتسجيلك حسابًا لدى شركة رو تريدينج المحدودة، فإنك تُقر بأنك تُسجل بمحض إرادتك، دون أي تحريض من جانب Raw Trading Ltd .

    لا تُوجِّه Raw Trading Ltd موقعها الإلكتروني وخدماتها لأي فرد في أي دولة يُحظر فيها استخدام موقعها وخدماتها بموجب القوانين أو اللوائح المحلية. عند الوصول إلى هذا الموقع من دولة قد يُحظر فيها استخدامه، تقع على عاتق المستخدم مسؤولية ضمان توافق أي استخدام للموقع أو الخدمات مع القوانين أو اللوائح المحلية. لا تُقرّ شركة Raw Trading Ltd بأن المعلومات المتوفرة على موقعها الإلكتروني مناسبة أو صالحة للاستخدام في جميع الولايات القضائية.

    الوثائق القانونية

    © 2022 Raw Trading Ltd | All rights reserved.
    • Sample Page